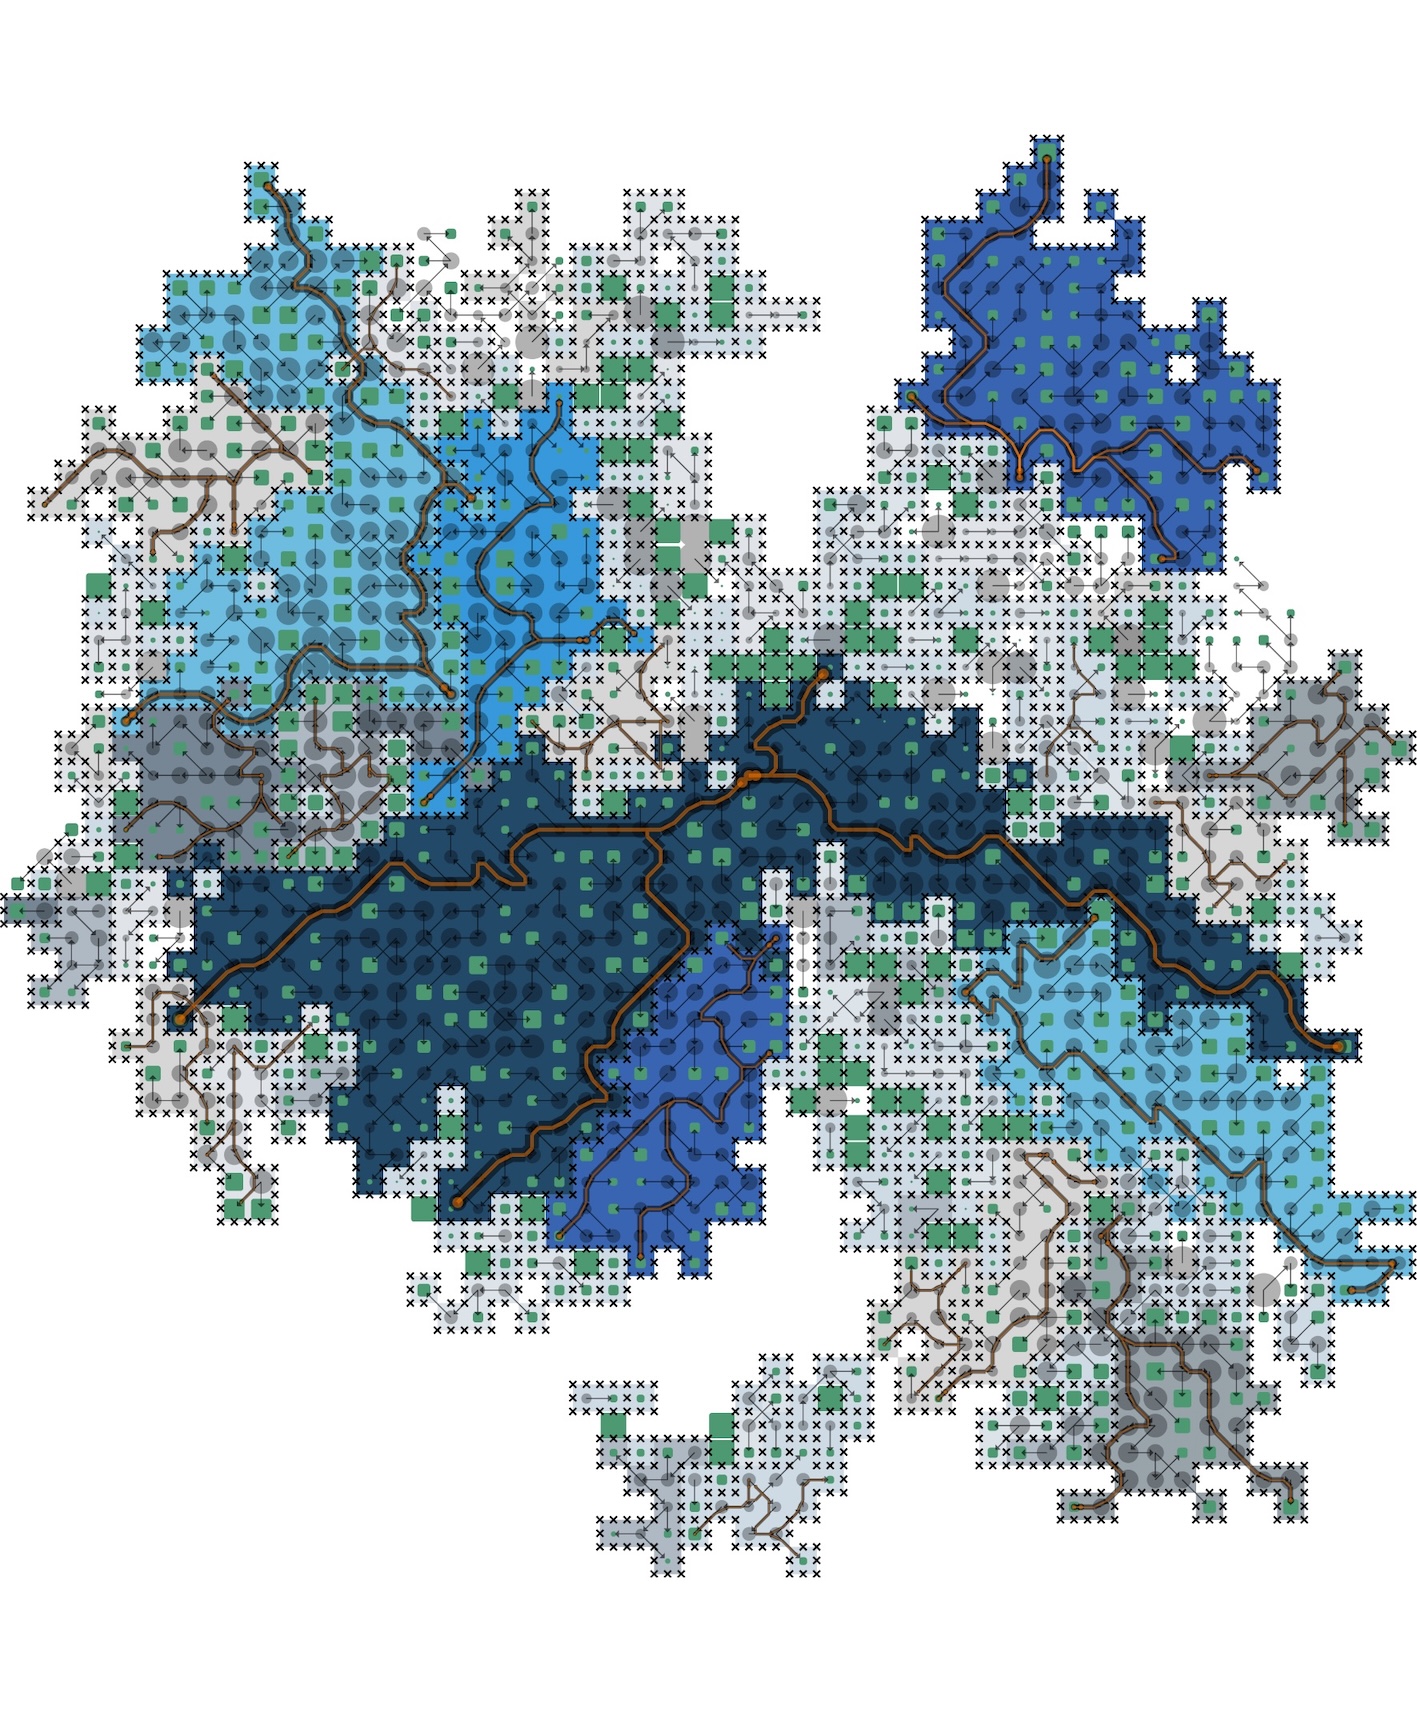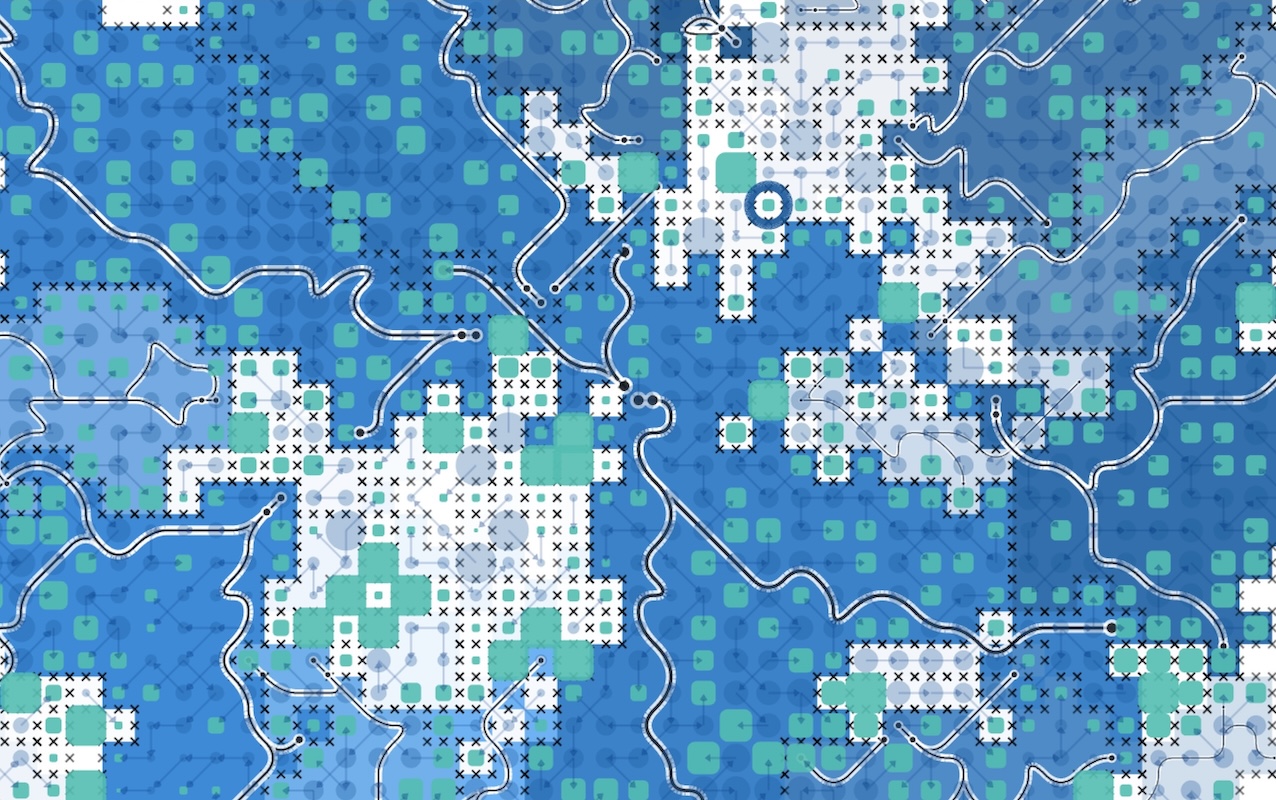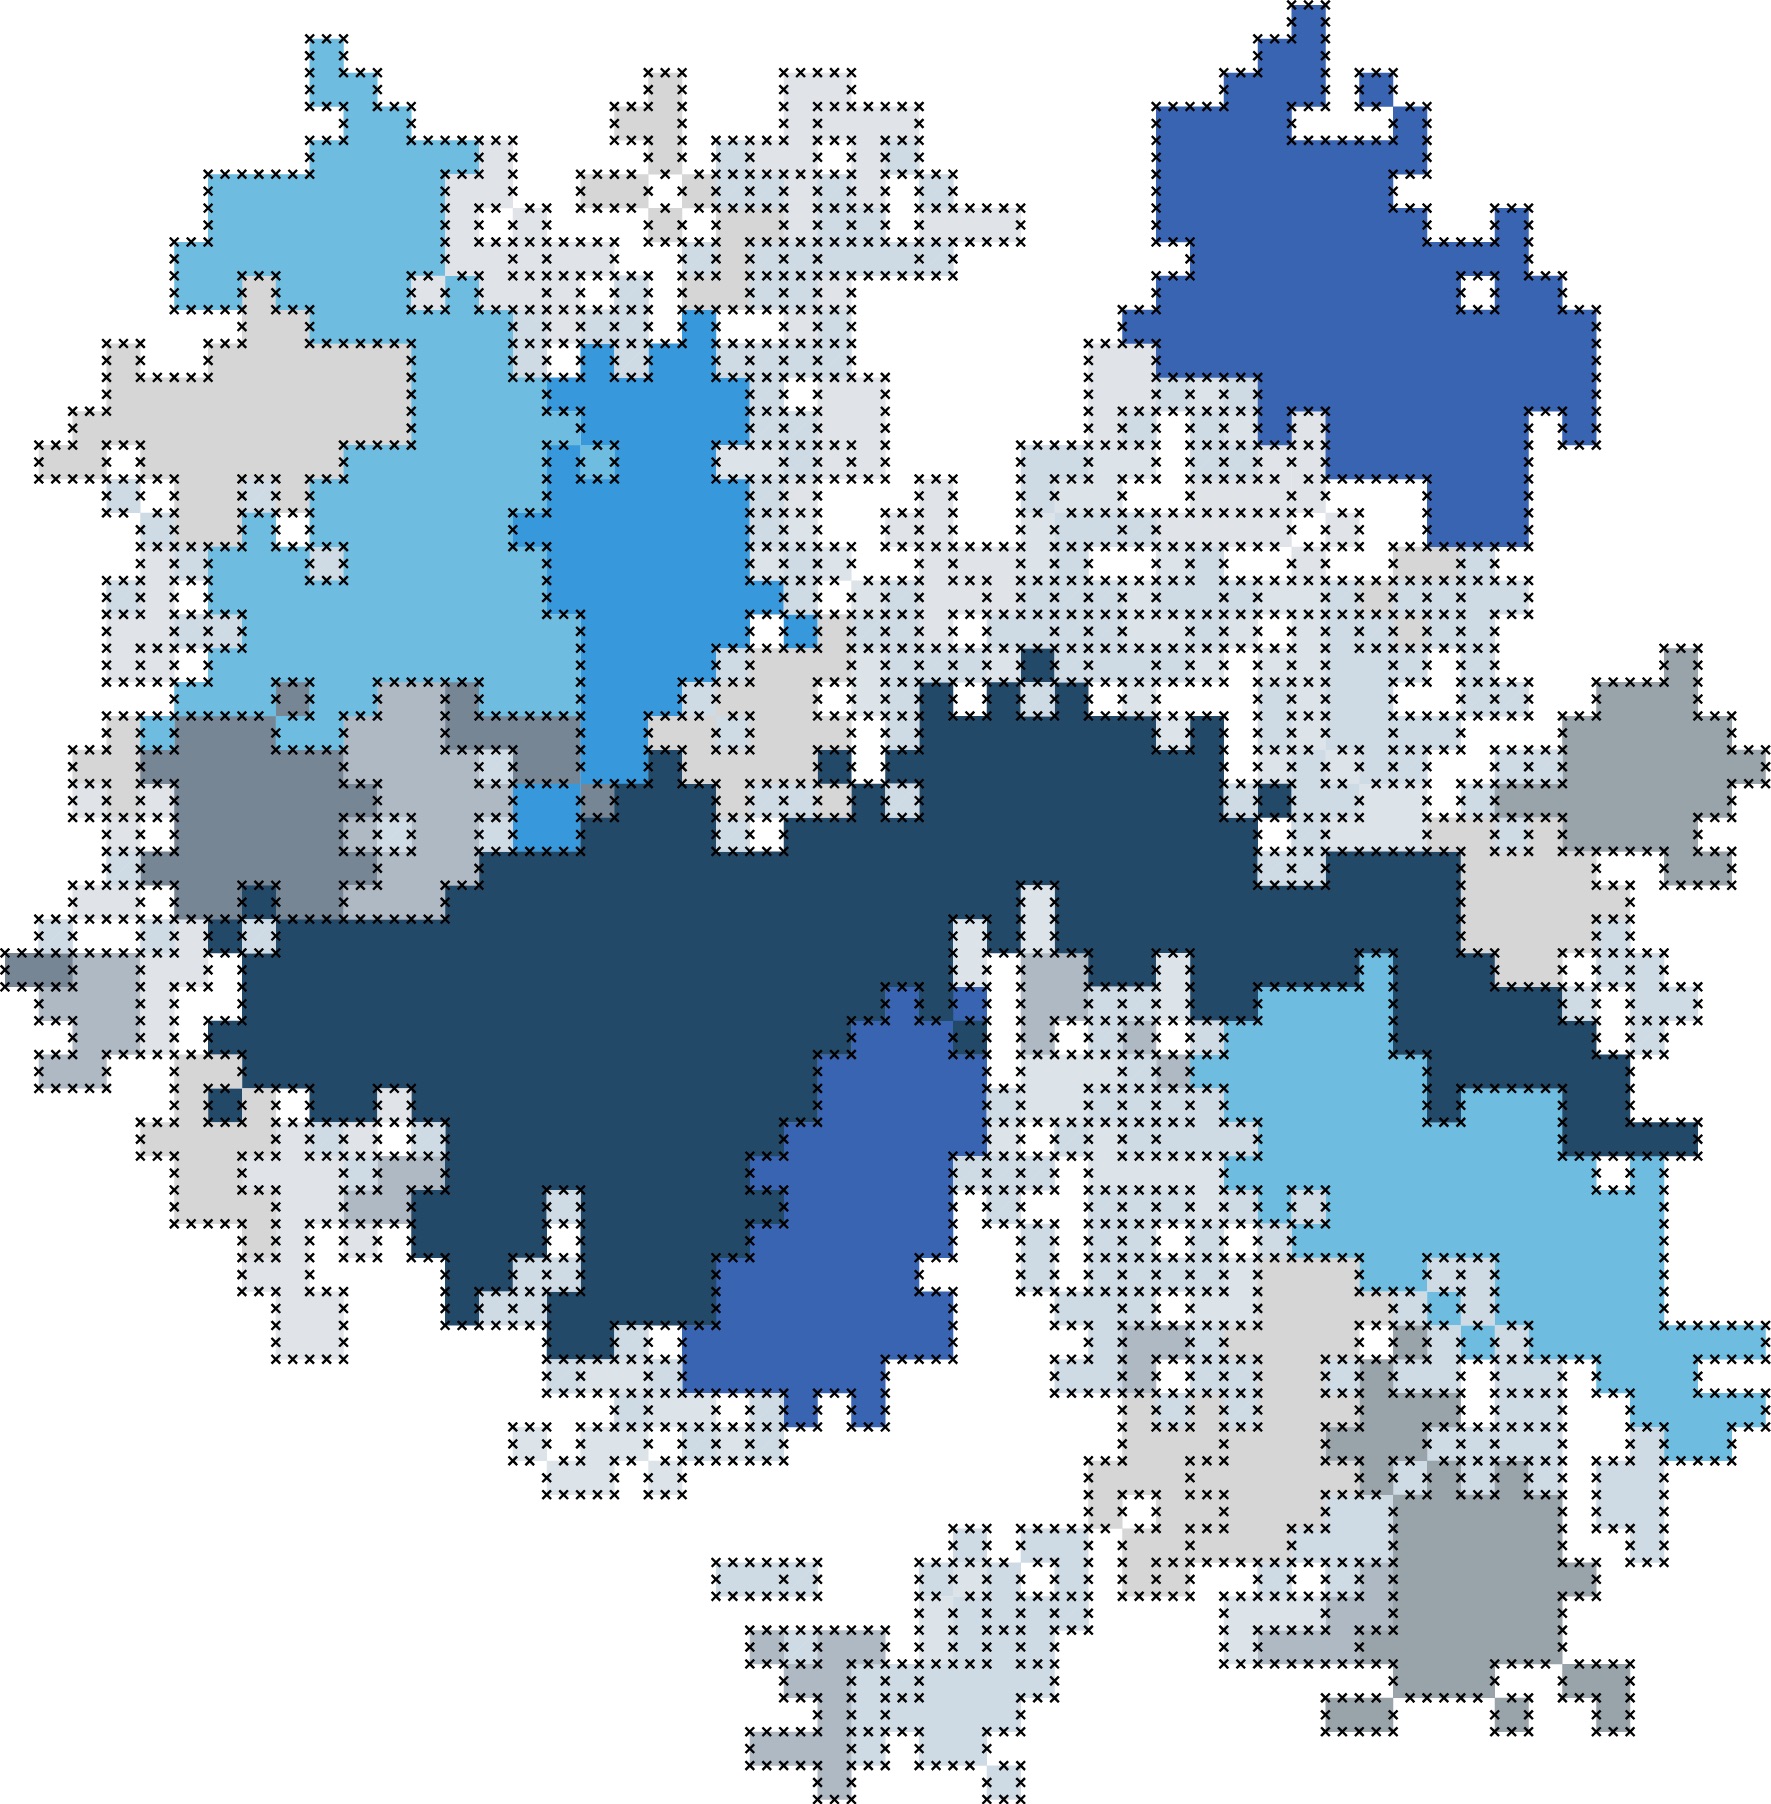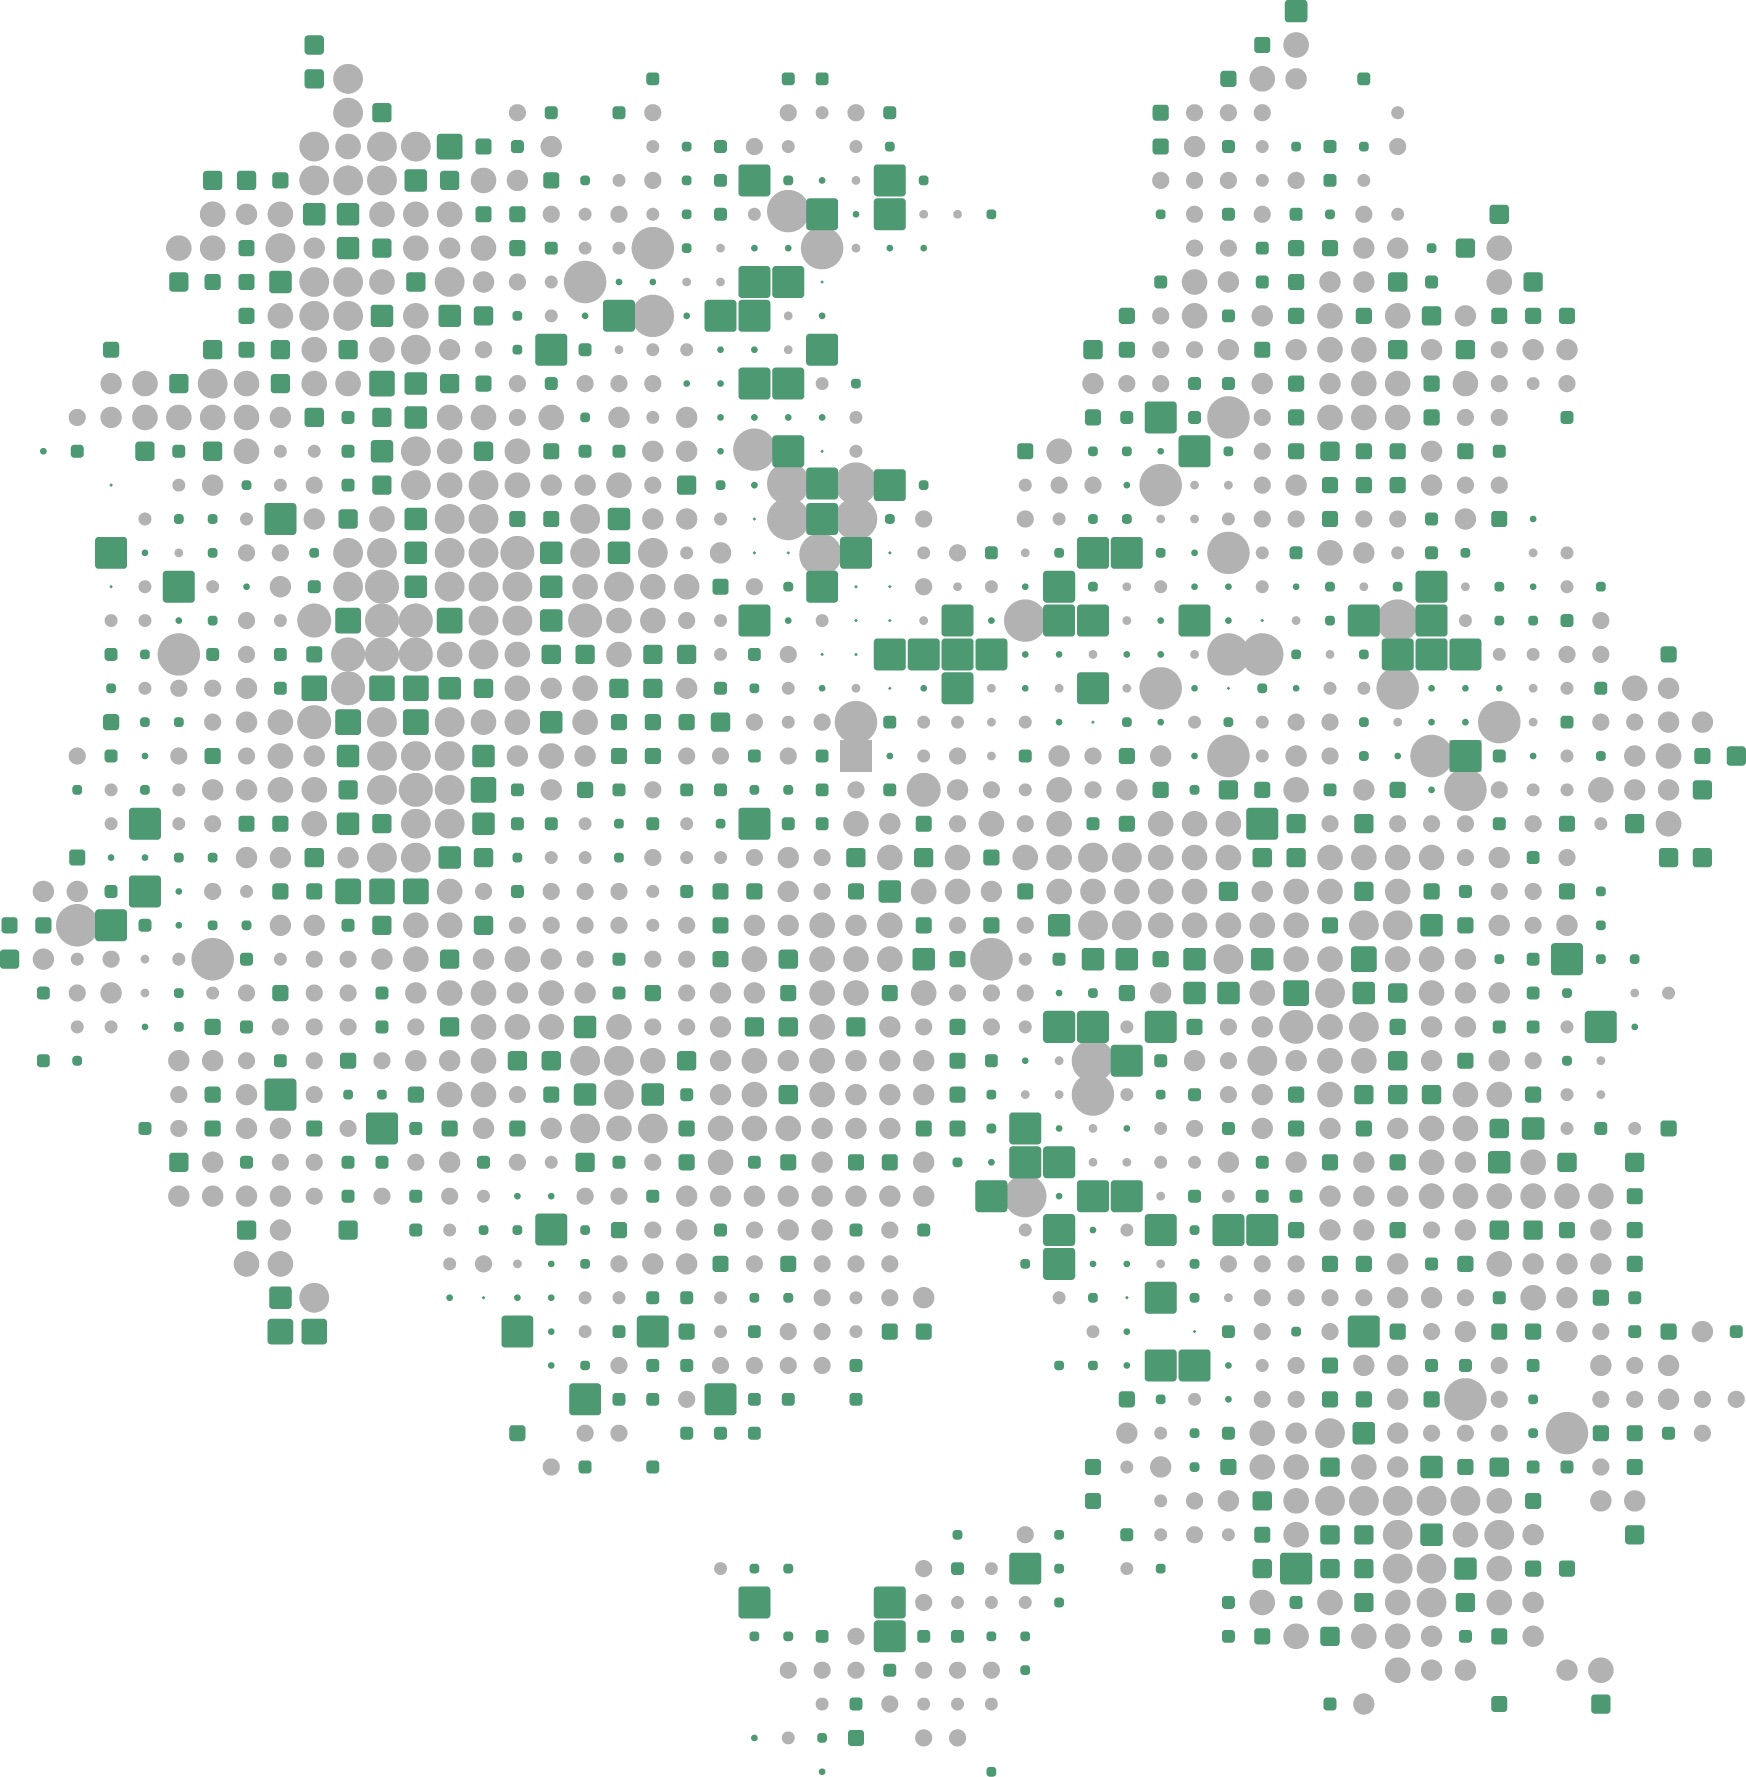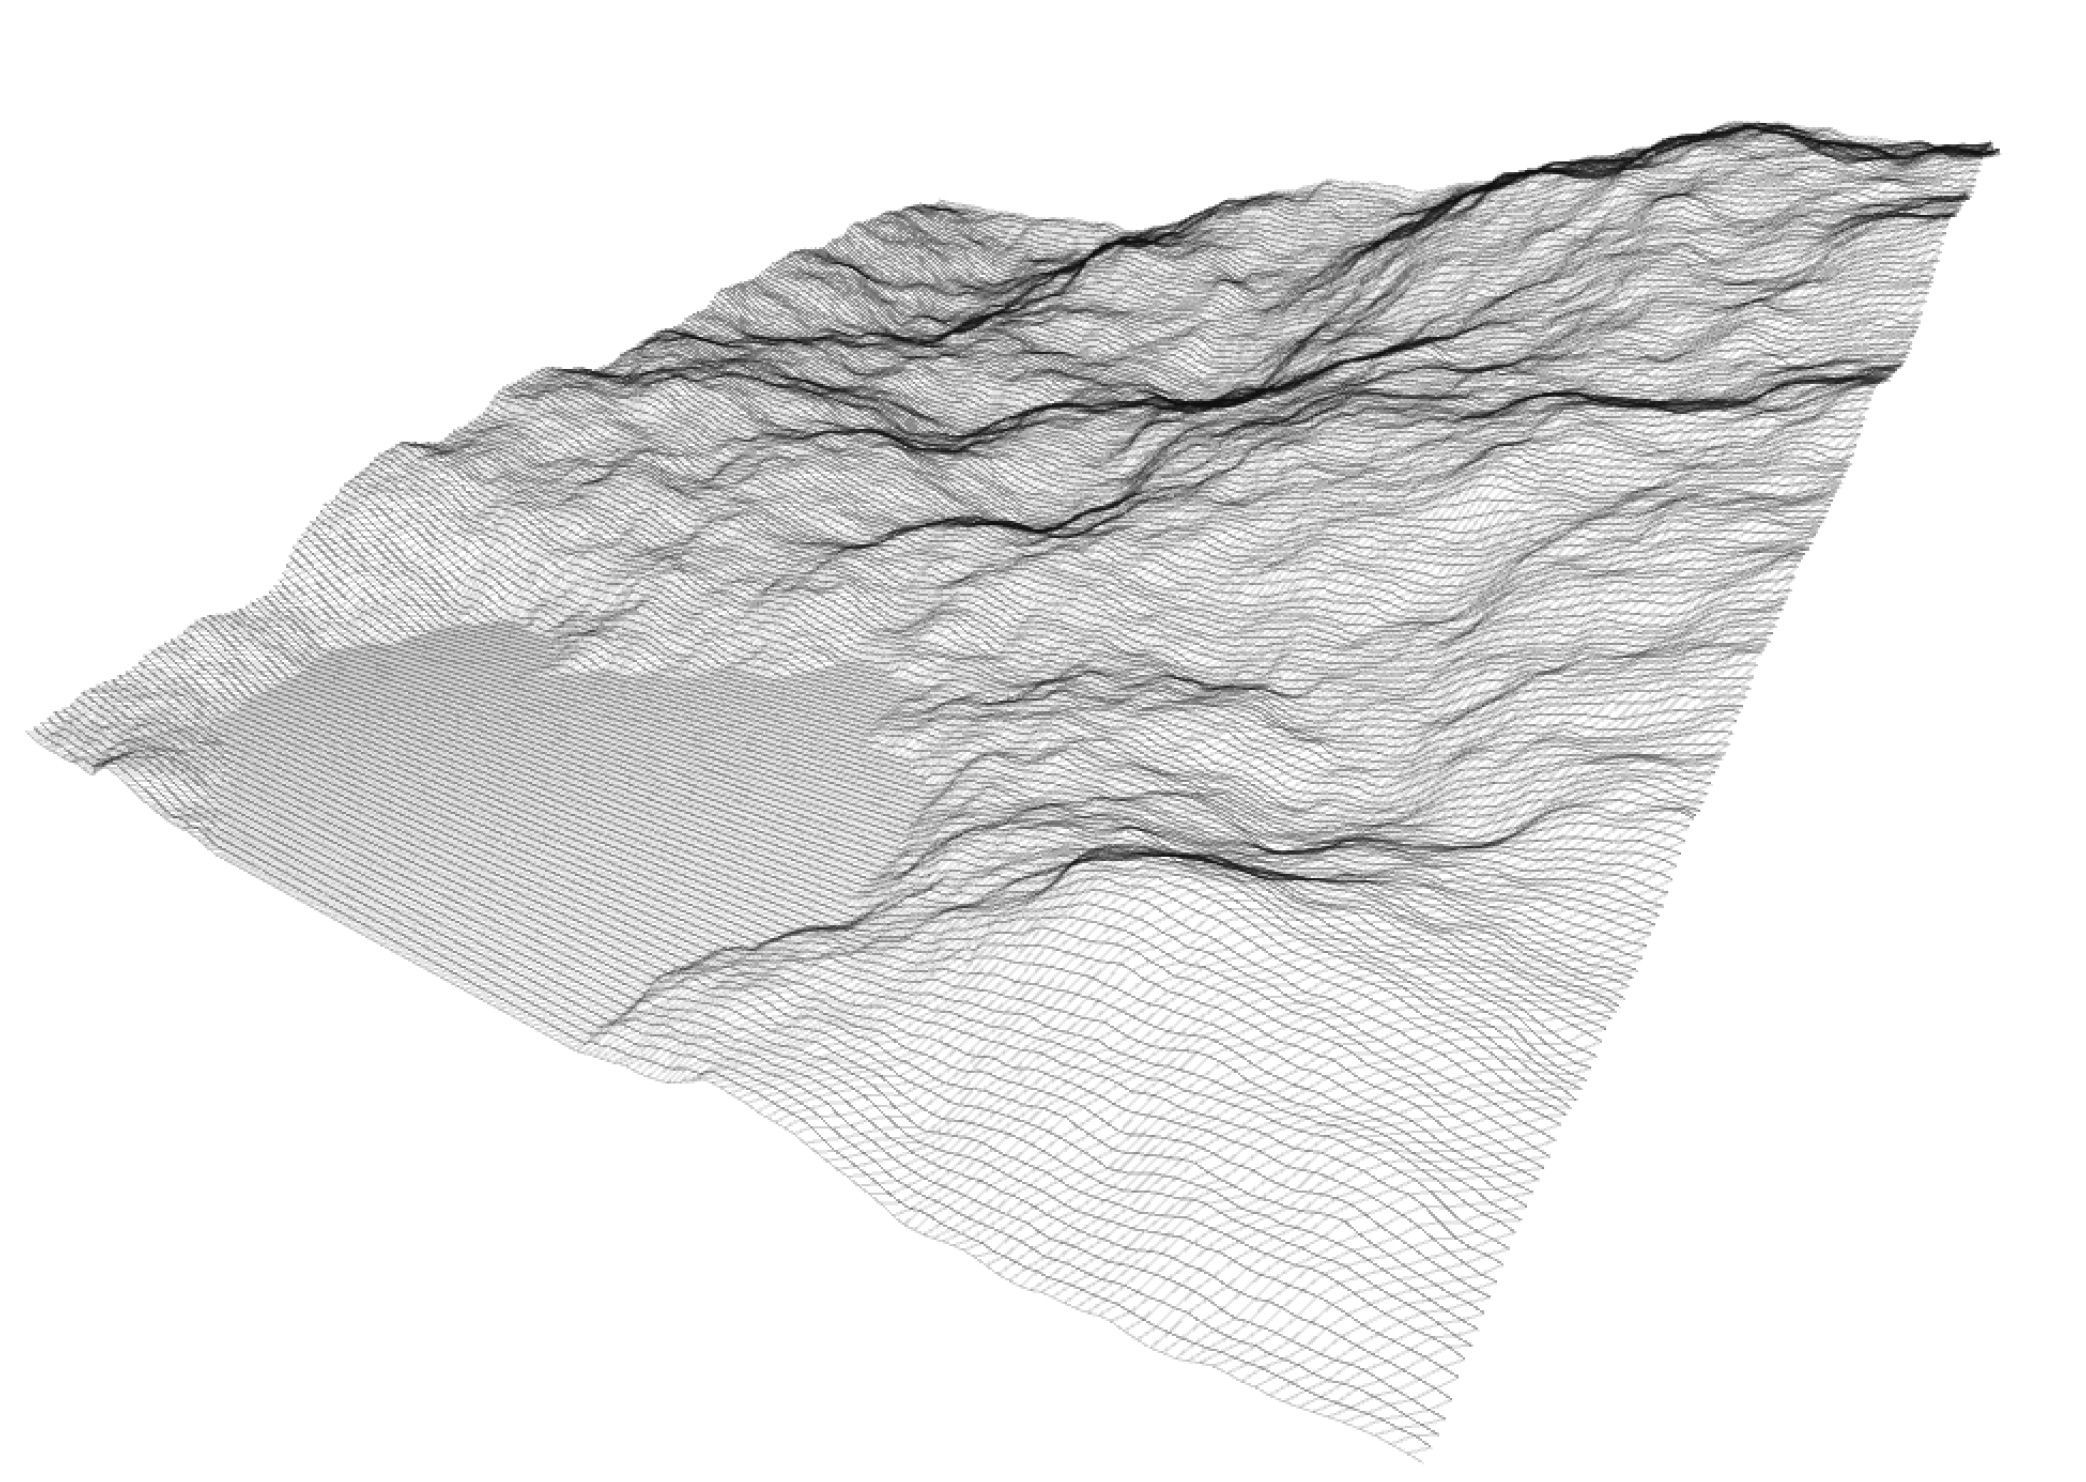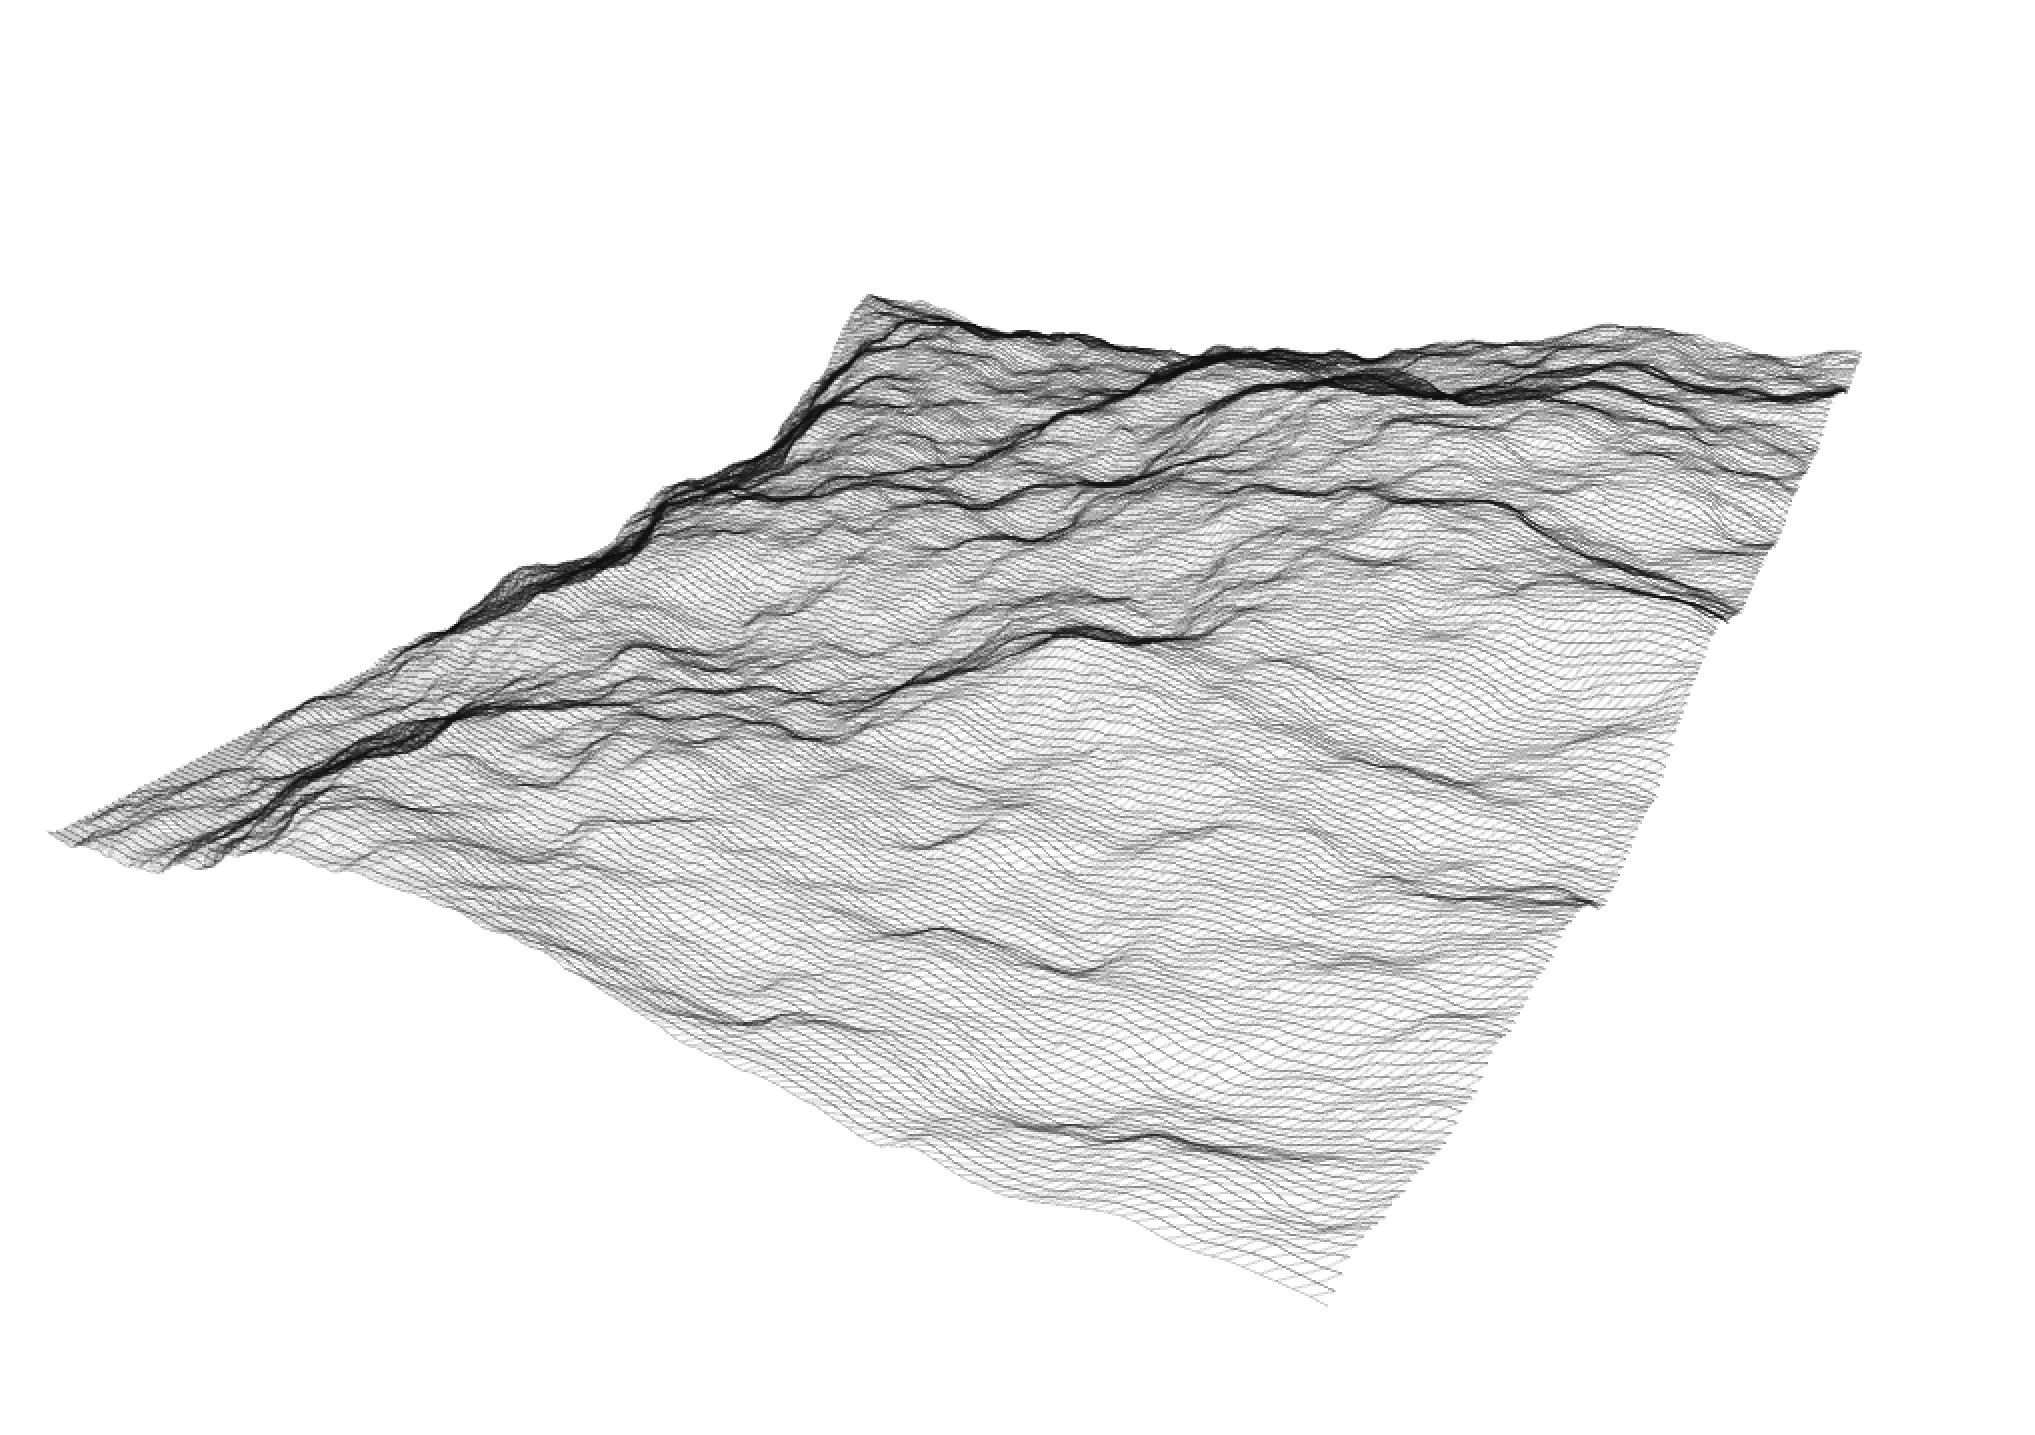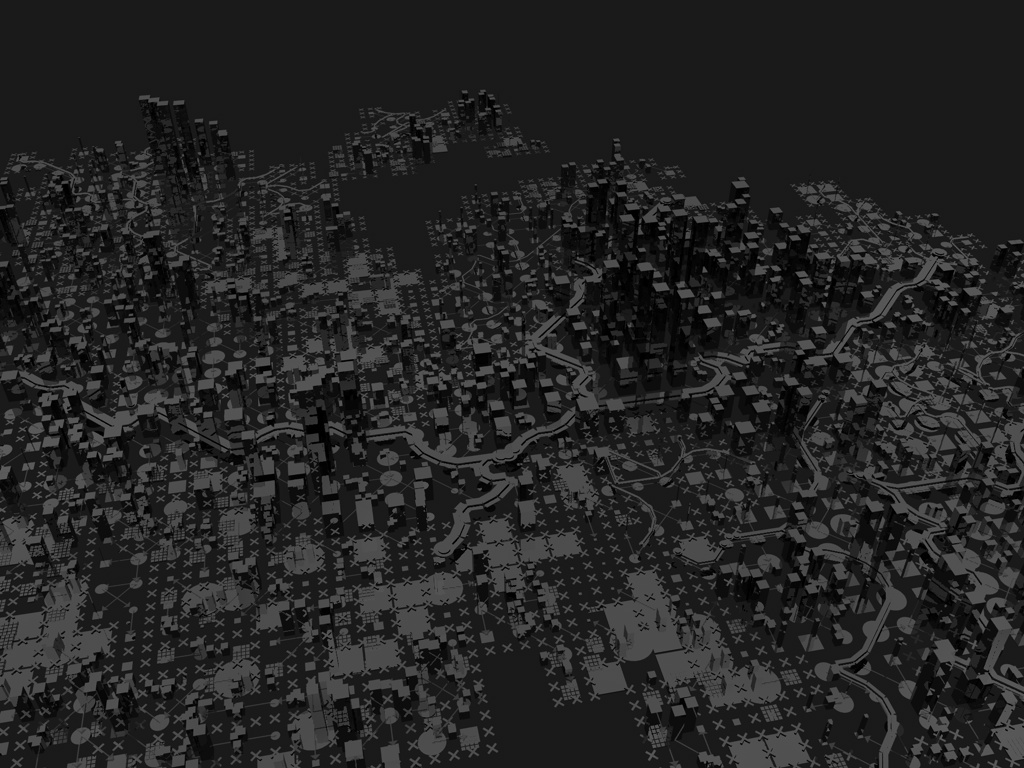
Visual clustering using topography
Perlin
Noise
Clustering
Cinder
Processing
C++
Java
Cinema4D
UdK
2013
When analyzing large volumes of visualized data, our initial attention is naturally drawn to prominent outliers. From there, we delve deeper, identifying key values within smaller components. The surrounding city-shaped visualizations emphasize categorization and clustering while leaving space for deeper insights. This approach to information visualization prioritizes two fundamental attributes: position and size. Where are the districts? What are they composed of? How do they interconnect?